Posted in EDUCATIONAL ADVICE, Practical

Notes on Sources of Error in A-Level H2 Biology Practicals

These notes consolidate the recurring sources of error across common H2 Biology practicals — enzyme kinetics, photosynthesis, respiration, osmosis/water potential, microscopy, and quantitative technique — together with the planning conventions (dilution, controls, precision, statistics) that determine whether an error is even avoidable in the first place.

1. The H2-Level Standard for “Source of Error” Answers

1.1 What Distinguishes a Full-Mark H2 Answer

At O-Level, a source of error can often be stated qualitatively. At H2, examiners expect the same three-part structure, but each part must be more mechanistically explicit and quantitatively aware.

  • Name the exact step or material at fault — e.g. “the interval between removing each potato disc from the corer and placing it into solution was not standardised”, not “timing error”.
  • Explain the mechanism and direction of the effect — link it explicitly to the underlying biological or physical process (enzyme kinetics, diffusion, water potential, absorbance) and state whether the recorded value is an over- or under-estimate.
  • Propose an improvement that is specific, feasible with standard laboratory apparatus, and clearly removes the source of error rather than merely repeating a flawed method.

1.2 Random Error versus Systematic Error

Source of ErrorEffect on ResultHow to Overcome / Improve
Random errorUnpredictable variation between repeats or replicates, e.g. biological variation between algal beads, reaction-time variation in starting a stopwatch, or variation in cutting tissue by hand.Increase the number of replicates and repeats (H2 planning conventions typically call for a minimum of 3 replicates per condition and the whole experiment repeated at least once, giving 12–15 data points for statistical validity); calculate a mean and identify/exclude anomalies.
Systematic errorA consistent bias in one direction from a flaw in equipment, calibration or technique, e.g. an uncalibrated eyepiece graticule, evaporation from an uncovered water bath, or heat from a lamp confounding a light-intensity investigation.Identify and correct the specific flaw in technique or apparatus. Repeats will not remove a systematic error, since every trial is biased in the same direction.

1.3 Reliability, Validity and Statistical Confidence

Reliability refers to whether an experiment gives consistent results on repetition; it depends on reproducibility (would the same data be obtained if repeated using the same procedure) and variability (how much replicated data deviates from the trend or from each other). Validity refers to whether only the independent variable was allowed to vary, with every other variable adequately controlled. Where relevant, a t-test can be used to determine whether the difference between two means is statistically significant, and a chi-squared test can be used to determine whether observed and expected frequencies differ significantly — both may be examined on Papers 1–3, with the concept examinable on Paper 4.

2. Planning Conventions That Prevent Avoidable Error

2.1 Precision and Significant Figures

Recording precision must match the limit of reading of the instrument used. All raw readings of the same type must be recorded to the same number of decimal places, and processed data (rates, percentages, ratios) should follow the significant figures of the least precise raw measurement used in the calculation — except where doing so would make it impossible to distinguish one processed value from another, in which case a consistent number of significant figures is chosen that preserves the distinction.

InstrumentSmallest DivisionRecorded ToExample
Stopwatch0.01 s (digital display)nearest 0.01 s (full display)13.42 s, 50.11 s — record to the instrument’s full precision; state the uncertainty separately as ± reaction time (≈0.2–0.3 s), rather than rounding the reading itself
Ruler1 mm0.5 mm (0.05 cm)10.0 mm, 7.5 mm
Thermometer1 °Cnearest 0.5 °C or 1 °C23.0 °C, 40.5 °C
Balance0.01 g / 0.1 gmatching smallest division121.00 g / 121.1 g
Colorimeter / data loggerinstrument-specificas displayed, consistent d.p.0.482 (absorbance)

A count (e.g. number of bubbles, number of cells) is always recorded as a whole number — fractional counts are a common but avoidable presentation error. Note also that the balance and the digital stopwatch above are recorded to the full smallest division shown, not half of it: the half-division convention applies to analogue scales, whereas a digital display’s uncertainty is taken as ± the smallest displayed digit, since a digital reading cannot be halved.

2.2 Dilution and Serial Dilution

Most H2 investigations require candidates to prepare a range of concentrations from a single stock solution using the formula C₁V₁ = C₂V₂ (concentration of stock × volume of stock = concentration of final × volume of final). Unless the question specifies otherwise, five concentrations at regular intervals are expected. A serial dilution reduces concentration by a constant factor at each step (e.g. ten-fold), so that each new tube is prepared from the previous tube rather than from the original stock.

Source of ErrorEffect on ResultHow to Overcome / Improve
Dilutions calculated or measured using a single syringe/pipette across increasing or decreasing concentrations without rinsing between transfers.Carry-over of a more concentrated (or more dilute) solution contaminates the next dilution, so the actual concentration in each tube deviates from the intended value — the error compounds down a serial dilution series.Use a syringe sized appropriately for the volume being measured, rinse with distilled water between transfers, or dedicate one syringe per solution where practicable.
Bubbles trapped in the syringe when measuring small volumes of stock or diluent.The true volume of reagent delivered is less than the volume read off the syringe scale, so the actual concentration prepared differs from the intended concentration.Invert the syringe and tap gently to move bubbles to the tip before expelling them, then take the reading.
Stock solution left uncovered for an extended period before use.Evaporation increases the concentration of the stock, so every dilution prepared from it is more concentrated than intended.Prepare stock solutions freshly, or keep them covered/sealed until immediately before use.

2.3 Designing a Valid Control

A control must be produced by replacing the specific factor under investigation — never simply removing it, since removing a reagent entirely also removes the volume/dilution consistency of the set-up. The control shows that the change observed is due to the factor being investigated and not to some other variable.

InvestigationAppropriate Control
Effect of light intensity on photosynthesisIdentical set-up kept in complete darkness (e.g. wrapped in foil), rather than simply omitting the light source from the description.
Effect of substrate concentrationReplace the substrate with an equal volume of distilled water (i.e. absence of substrate, but volume kept constant).
Effect of enzyme concentrationReplace the enzyme with an equal volume of boiled-and-cooled enzyme, or with distilled water, keeping total volume constant.
Rate of respiration of yeastReplace live yeast suspension with an equal volume/mass of boiled-and-cooled yeast, or distilled water.
Rate of respiration of an insect or seedsReplace the specimen with inert glass beads of equivalent mass, to control for any change in gas volume/pressure not due to respiration.
Effect of temperature or pH on enzyme activityCannot be negated by omission; use boiled-and-cooled enzyme (or distilled water in place of enzyme) as the negative control instead.

The full set of notes, which includes sections such as Sources of Error by Practical Topic is available in hard copy for students who sign up for any of our regular practical lessons, Crash Courses or Mock Exams.


LOOKING FOR THE BEST PLACE TO DO YOUR SCIENCE PRACTICALS? JOIN US!

Singapore Learner has been a Comprehensive Science Practical Training provider since 2017.

As at 19 Apr 2026, we have trained about 1060 students for their science practical exams and we have conducted a total of about 4044 lab sessions.

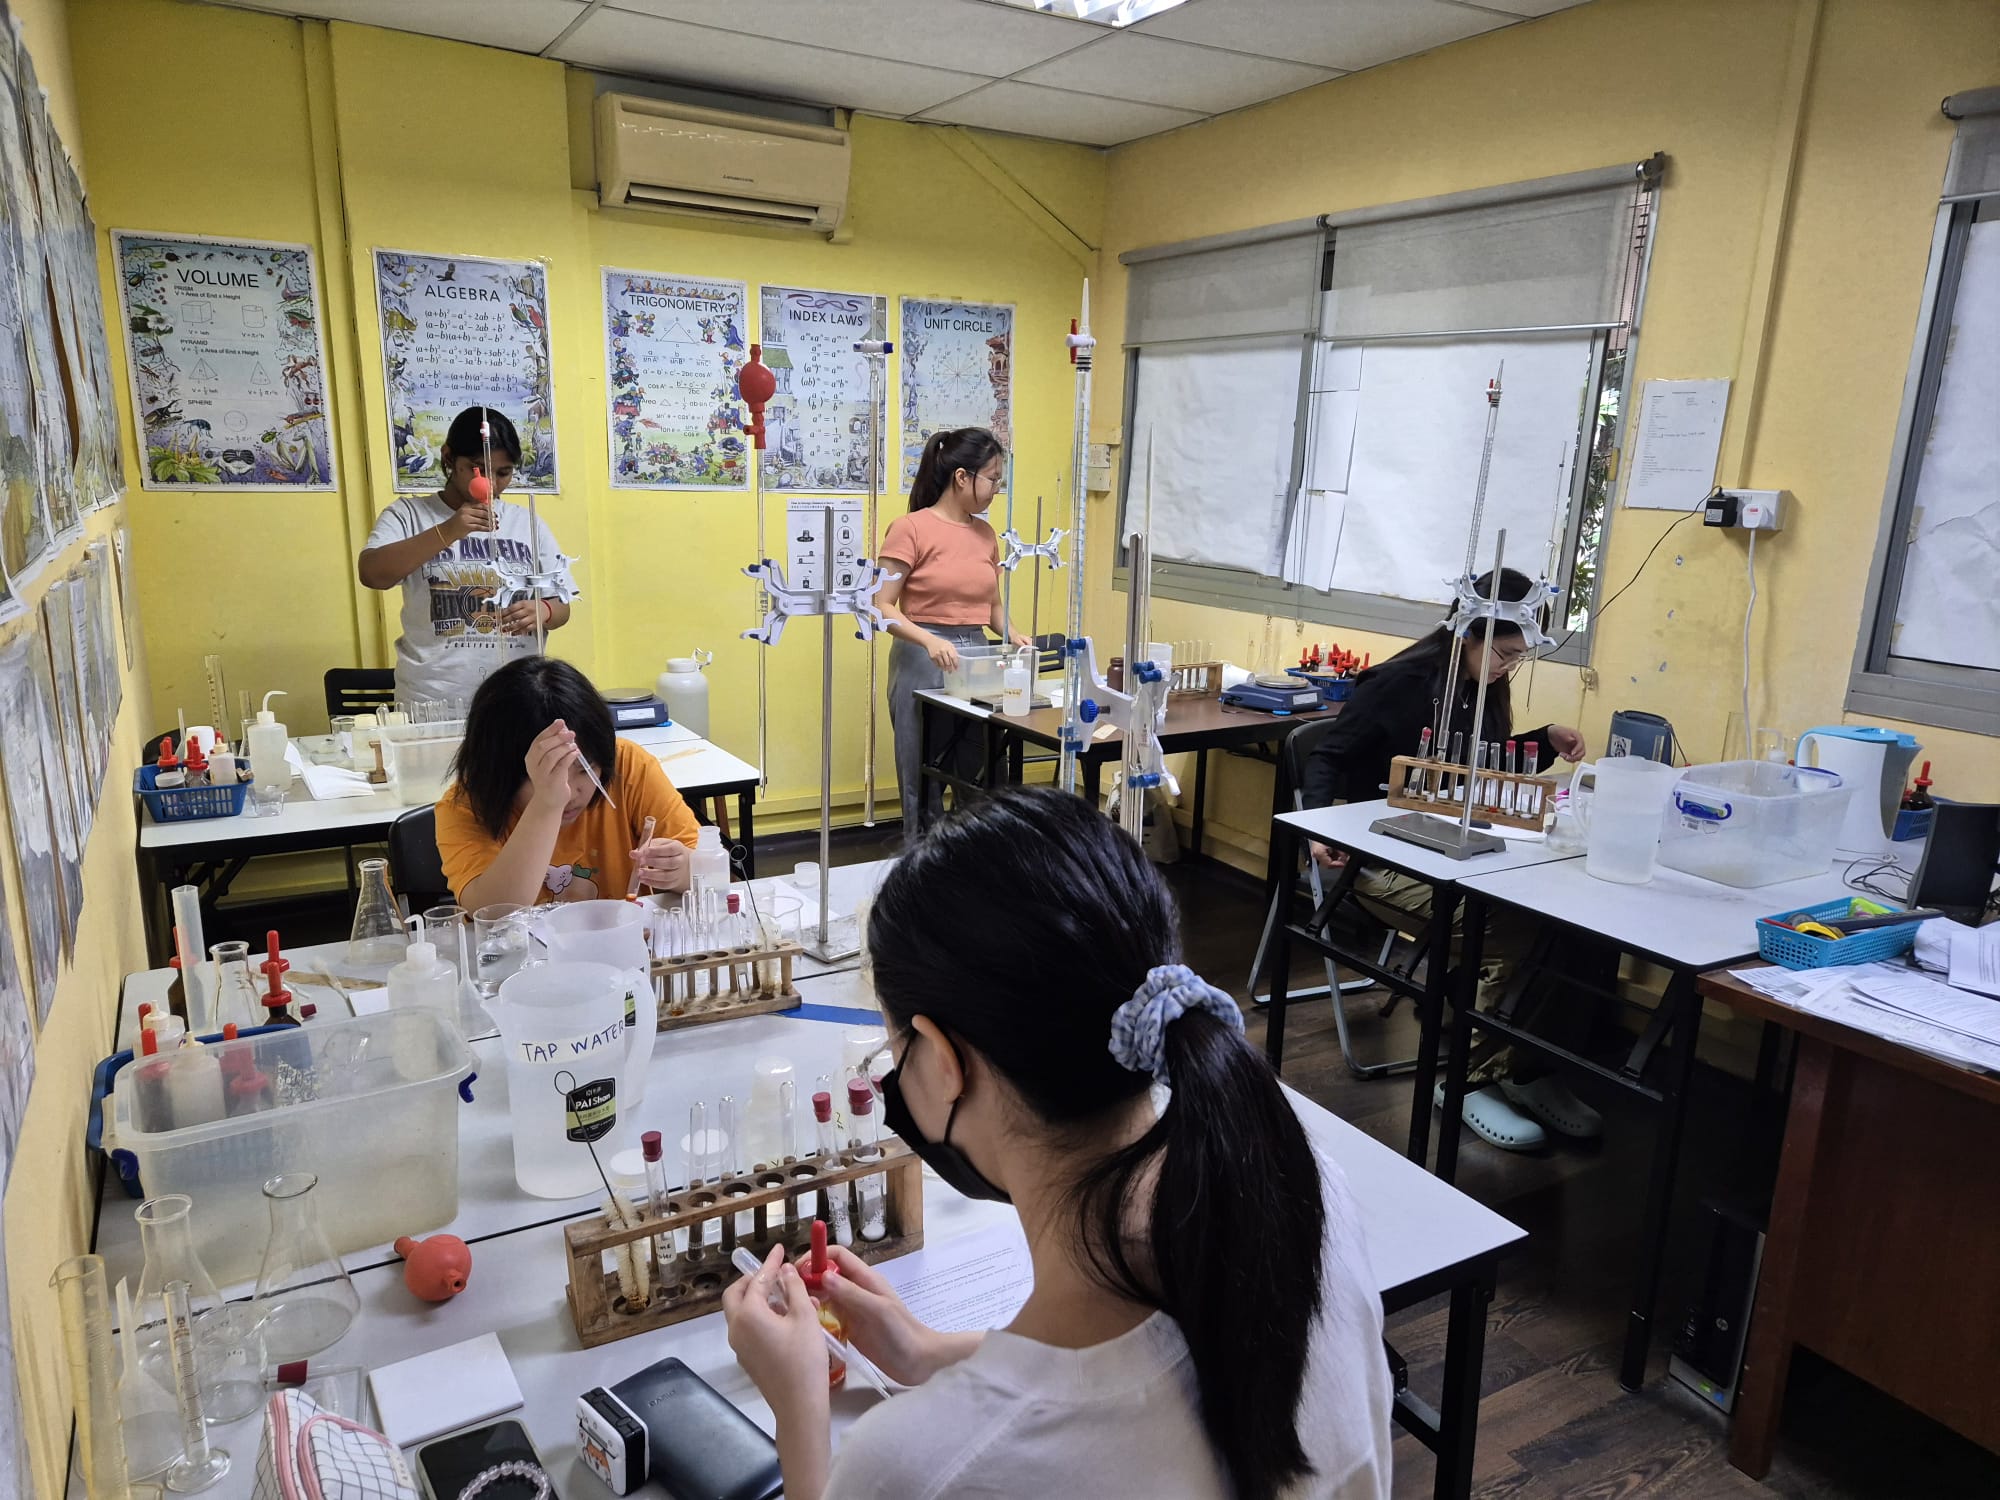
Our laboratory apparatus are exam-grade and similar to those used in MOE schools and our chemicals are all NEA-approved.


Why Choose Us?

  • Our teachers are very experienced, and we actually TEACH you good practical techniques.
  • We have been a one-stop comprehensive science practical centre providing solid practical training for ALL THREE sciences and for all levels and streams since 2017.
  • Our laboratory apparatus are exam-grade and similar to those used in MOE schools and our chemicals are all NEA-approved.
  • We have a structured practical training programme catering to the needs of both beginners and experienced students.
  • We have a small class size so that the teacher is able to observe the actions of each student more closely and demonstrate the correct practical techniques where and when necessary.
  • Many private schools trust us to prepare and conduct science practical training and assessment for their students, including structured training, mock exams and even actual CIE science practical exams.

Our Main Practical Programmes:

A-LEVEL H2 PRACTICALS (Available Nov to Oct)

O-LEVEL PRACTICALS (Available Nov to Oct)

PRACTICAL CRASH COURSES (Jun, July, Sep and Oct)

MOCK EXAMS FOR SCIENCE PRACTICAL (Apr to Oct)

Posted in EDUCATIONAL ADVICE

Notes on O-Level Qualitative Analysis (QA)

What is QA?

In chemistry, qualitative analysis refers to the process of identifying what substances are present in an unknown sample. The emphasis is on the properties and reactions observed, rather than numeric measurements.

During qualitative analysis, you focus on:

  • the appearance of a substance;
  • colour changes or changes in physical state, such as the formation of a precipitate (solid) or the evolution of a gas; and
  • the interaction of the substance with test reagents such as litmus paper.

This differs from quantitative or volumetric analysis, which involves taking measurements to determine the amount or concentration of a substance.

You should be familiar with the standard chemical tests for the following ions and gases:

  • Cations: aluminium, ammonium, calcium, copper(II), iron(II), iron(III), zinc
  • Anions: carbonate, chloride, sulfate, nitrate
  • Gases: ammonia, carbon dioxide, chlorine, hydrogen, oxygen, sulfur dioxide

Important Notes

  1. No practical tests involving sulfur dioxide are required.
  2. A positive acidity test indicates the presence of H⁺ ions, whereas a positive alkalinity test shows the presence of OH⁻ ions.

General Guidelines for QA

Experimental Techniques and Skills

1. Apparatus

  • Use test‑tubes or boiling tubes to perform most tests. Boiling tubes are slightly larger and more heat‑resistant than standard test‑tubes.
  • Check that all glassware is clean, dry, and free from cracks before use.
  • For accurate colour observation, hold the test‑tube against a white tile or sheet of white paper for contrast.

2. Samples

  • Use a spatula for solids and a dropper for small liquid volumes.
  • Unless otherwise instructed, use:
    • not more than 1 cm depth of solid, or
    • not more than 2 cm depth of solution in a test‑tube.
  • Using excess samples can obscure reactions or cause safety hazards.

3. Technique

  • Work carefully and deliberately.
  • Unless stated otherwise, add reagents drop by drop.
  • Prepare all materials beforehand so you can focus on one test at a time.
  • When heating:
    • Hold the test‑tube with tongs or a holder.
    • Begin with gentle heating before increasing intensity.
    • Always point the mouth of the test‑tube away from yourself and others.
    • If the reaction becomes vigorous, remove it from the flame immediately.

Making and Recording Observations

After each test:

  • Record your observations immediately while they’re fresh.
  • Draw inferences and conclusions clearly and accurately.
  • Summarise these in your practical notes or report.

When recording data:

  • Include ALL noticeable observations — colour changes, precipitates formed, and gases evolved.
  • Use clear, specific terminology so that another person could replicate or understand your results easily.

1. Describing Colours

  • Always describe every colour change that takes place.
  • Use simple, accurate colour descriptions such as “blue,” “green,” “yellow,” “orange,” “brown,” “white,” or “black.”
  • If mixed colours appear and no exact shade can be determined, use compound terms such as red‑brown, blue‑green, or yellow‑green.
  • Avoid imprecise or hybrid colour phrases like red‑yellow (when “orange” is more accurate).
  • The words light or dark may be used for shades.
  • If a gas or liquid is clear and has no colour, describe it as colourless, not white.

2. States of Matter and Their Descriptions

(a) Solids

  • Describe solids as crystalline, powdery, or metallic in appearance.
  • When two solutions form an insoluble solid, that solid is called a precipitate.
  • A solid forming on another surface is a deposit, and one remaining after heating or filtration is a residue.

(b) Liquids

  • A solution is a uniform mixture of solute and solvent.
  • A cloudy or turbid liquid indicates a suspension — tiny particles are dispersed but not dissolved.

(c) Gases

  • Observe whether gases have distinctive smells but never inhale directly — waft gently toward your nose instead.
  • A solid that forms when a gas cools is called a sublimate or deposit.

(d) Changes Upon Heating

  • A solid may convert into another solid (residue) of different appearance.
  • Some solids decompose completely and leave no solid.
  • A few solids sublime, turning directly into gas.
  • When bubbles form in a liquid as a gas evolves, describe the observation as “effervescence is observed” instead of simply “a gas is produced.”

Procedures and Observations for Tests

Test for Aqueous Cations

Cations are typically identified using aqueous sodium hydroxide (NaOH) and aqueous ammonia (NH₄OH).

Procedure:

  1. Place about 2 cm of the unknown solution into a test‑tube.
  2. Tilt the tube slightly and add the reagent slowly down the side.
  3. Observe any colour change or precipitate.
  4. Return the tube upright and swirl gently.
  5. Continue adding reagent in excess until no further change occurs.

Observation Checklist:

  • Whether a precipitate forms
  • Colour of the precipitate
  • Whether it is soluble in excess reagent
  • If ammonia gas is released when using NaOH

Summary Table: Tests and Observations for Common Cations

CationAqueous Sodium hydroxide, NaOH(aq)Aqueous Ammonia, NH₃(aq)
Adding a few dropsAdding excessAdding a few dropsAdding excess
Aluminium ion (Al³⁺)White ppt of Al(OH)₃Dissolves to a colourless solutionWhite pptInsoluble
Zinc ion (Zn²⁺)White ppt of Zn(OH)₂Dissolves to colourless solutionWhite pptDissolves to colourless solution
Calcium ion (Ca²⁺)White ppt of Ca(OH)₂InsolubleNo pptNo change
Ammonium ion (NH₄⁺)No ppt. On warming, NH₃ gas released; turns litmus blue.No change  
Copper(II) ion (Cu²⁺)Light blue ppt of Cu(OH)₂InsolubleLight blue pptDissolves in excess to dark blue solution
Iron(II) ion (Fe²⁺)Green ppt of Fe(OH)₂Insoluble; turns brown on standingGreen pptInsoluble; turns brown on standing
Iron(III) ion (Fe³⁺)Red‑brown ppt of Fe(OH)₃InsolubleRed‑brown pptInsoluble

Note: Iron(II) hydroxide quickly oxidises in air to form brown iron(III) hydroxide.

If no precipitate appears with NaOH and no ammonia is evolved, the cation is likely a Group I metal (e.g. Na⁺, K⁺).


Test for Aqueous Anions
 
Anions are tested systematically using dilute nitric acid (HNO₃) first to eliminate interfering ions. When testing for nitrate, you must use another reagent because nitric acid itself contains nitrate ions.


Phase 1 : Test for Carbonate (CO₃²⁻)
Add about 2 cm of the unknown sample to a test‑tube.
Place a drop on red litmus paper.
If the paper turns blue, add a few drops of dilute nitric acid.
If effervescence occurs, confirm with the limewater test. A white ppt that dissolves on further bubbling proves the presence of carbonate ions (CO₃²⁻).
If no gas forms, the sample is an alkali (contains OH⁻).
If litmus stays red, move to the next phase.


Phase 2 : Test for Chloride (Cl⁻) or Iodide (Pure Chem)
Acidify the solution from Phase 1 with nitric acid.
Add aqueous silver nitrate down the side of the tube.
Observation of a white precipitate confirms chloride ions. (Pure Chem: if a yellow ppt. is observed, then iodide ions confirmed)
If no ppt forms, proceed to Phase 3.


Phase 3 : Test for Sulfate (SO₄²⁻)
Add aqueous barium nitrate (Ba(NO₃)₂) to the previous acidified mixture.
Formation of a white precipitate confirms sulfate ions (SO₄²⁻).
If no ppt forms, proceed to Phase 4.


Phase 4 : Test for Nitrate (NO₃⁻)
Place fresh solution (no nitric acid added) in a clean tube.
Add aqueous sodium hydroxide and a small piece of aluminium foil.
Warm gently.
Test the gas with damp red litmus paper – if it turns blue, ammonia gas is produced, confirming nitrate ions.

Summary Table: Tests and Observations for Common Anions

AnionTestObservation
Carbonate ion (CO₃²⁻)1. Test the solution with red litmus paper.Red litmus paper turns blue.
2. Add dilute nitric acid.Effervescence is observed.
3. Test for CO2 by bubbling the gas through limewater.The gas produced, CO2, forms a white precipitate of calcium carbonate in limewater that dissolves after more bubbling.
Chloride ion (Cl⁻)Add dilute nitric acid, then aqueous silver nitrate.Formation of a white precipitate of silver chloride (AgCl).
Sulfate ion (SO₄²⁻)Add dilute nitric acid, then aqueous barium nitrate.Formation of a white precipitate of barium sulfate (BaSO₄).
Nitrate (NO₃⁻)1. Add NaOH and aluminium foil, then warm.Effervescence is observed.
2. Test for ammonia gas with damp red litmus paper.The gas produced, ammonia gas, turns damp red litmus paper blue.

Notes:

  1. Always eliminate hydroxide and carbonate ions first using litmus and acid tests.
  2. Test for nitrate only when other ions have been ruled out.

Test for Gases
These procedures help you identify gases by their effects and reactions.


Phase 1:  Determine Acidic, Basic, or Neutral Gas
Hold damp red and blue litmus papers near the gas source.
Red → Blue → Gas is ammonia (NH₃).
Blue → Red → Could be CO₂, SO₂, or Cl₂ (proceed to Phase 2).
Blue → Red then bleached → Chlorine (Cl₂) or Sulfur dioxide (SO₂).
No change → Gas is neutral (H₂ or O₂).
⚠️ A yellow‑green gas indicates concentrated chlorine – a severe inhalation hazard.


Phase 2 : Testing Acidic Gases
If blue litmus turns red (not bleached): bubble gas through limewater.
A white precipitate dissolving in excess gas → Carbon dioxide.
If blue litmus turns red and bleaches: hold acidified potassium manganate(VII) paper at tube mouth.
Paper turns from purple to colourless → Sulfur dioxide.
Paper stays purple → Chlorine.
(Chlorine can also turn potassium iodide‑starch paper blue, but this confirmatory test is usually unnecessary.)


Phase 3 : Testing Neutral Gases
Add a metal and apply a burning splint: “pop” sound → Hydrogen.
Without metal, insert a glowing splint: relights → Oxygen.

Summary Table: Tests and Observations for Gases

GasEffect on Litmus Further Test and Observation
Ammonia  (NH₃)Turns damp red litmus paper blue. 
Carbon  dioxide (CO₂)Turns damp blue litmus paper red.Formation of white precipitate when bubbled through limewater. With further bubbling, the white precipitate dissolves in limewater.
Chlorine (Cl₂)Turns damp blue litmus paper red, then bleaches it.Turns potassium iodide (KI) solution from colourless to brown   Or   Turns potassium iodide (KI) starch paper to purple or dark blue*   *This is a positive test for an oxidising agent, Cl₂.
Hydrogen  (H₂)No observed changeA burning splint is extinguished with a “pop” sound.
Oxygen (O₂)No observed changeA glowing splint is relighted.
Sulfur  dioxide (SO₂)Turns damp blue litmus paper red.Turns acidified potassium manganate(VII) (KMnO₄) from purple to colourless**   **This is a positive test for a reducing agent, SO₂.

⚠️ Some gases, like chlorine and sulfur dioxide, have pungent, irritating odours and can be poisonous. Always waft carefully, and do not inhale directly.


Singapore Learner has been a Comprehensive Science Practical Training provider since 2017.

Our laboratory apparatus are exam-grade and similar to those used in MOE schools and our chemicals are all NEA-approved.


Why Choose Us?

  • Our teachers are very experienced, and we actually TEACH you good practical techniques.
  • We have been a one-stop comprehensive science practical centre providing solid practical training for ALL THREE sciences and for all levels and streams since 2017.
  • Our laboratory apparatus are exam-grade and similar to those used in MOE schools and our chemicals are all NEA-approved.
  • We have a structured practical training programme catering to the needs of both beginners and experienced students.
  • We have a small class size so that the teacher is able to observe the actions of each student more closely and demonstrate the correct practical techniques where and when necessary.
  • Many private schools trust us to prepare and conduct science practical training and assessment for their students, including structured training, mock exams and even actual CIE science practical exams.

Our Main Practical Programmes:

A-LEVEL H2 PRACTICALS (Available Nov to Oct)

O-LEVEL PRACTICALS (Available Nov to Oct)

SEC 3 PRACTICALS (Available Nov to Jun)

SEC 1-2 PRACTICALS (Available Nov to Jun)

P3 – P6 PRACTICALS (Available Nov to Jun)

PRACTICAL CRASH COURSES (Jun, July, Sep and Oct)

MOCK EXAMS FOR SCIENCE PRACTICAL (Apr to Oct)

March Holiday Science Enrichment (P4 – S2)